Sharpening CIDER's Debugging Tools
The series on the notable changes in CIDER 2.0 rolls on. This time: the “what is my code actually doing?” toolbox - the debugger, tracing, enlighten, and the new tap viewer. This was the part of the release I enjoyed working on the most, and the part that needed the most love.
The debugger, dusted off
CIDER’s interactive debugger is one of its most impressive features and,
paradoxically, one of its least reliable ones. Instrumenting arbitrary Clojure
code is hard - the debugger rewrites your forms to capture locals at every
step, and the corner cases are endless. Over the 2.0 cycle (and the 0.62.x
releases of cider-nrepl) a whole family of long-standing instrumentation bugs
got fixed:
- Record literals embedded in code survive instrumentation instead of being quietly downgraded to plain maps - which used to break protocol dispatch in anything that compiled routes or components into records (compojure users know the pain).
defrecord/deftypeinline methods no longer blow up with the infamousUnable to resolve symbol: STATE__error - the instrumenter now sensibly skips the method bodies, which compile to real JVM methods that can’t capture debugger state.#dbgon a bare collection literal triggered the same error; fixed too. And heavily destructured argument lists used to crash instrumentation in their own special way - not anymore.- A form too large to instrument (yes, that’s a JVM limitation -
Method code
too large!
) now degrades gracefully: CIDER retries without local capture and tells you what happened, instead of surfacing a raw compiler error. - Quitting a debug session uses nREPL’s interrupt machinery instead of the
deprecated
Thread.stop, so it keeps working on modern JDKs whereThread.stopis simply gone.
The UX got attention too. Quitting the debugger with q finally restores point
to where you started the session - a request filed in
2016 - instead of
stranding you at the last breakpoint. The force-step-out key works again. And
all the debugger’s single-key commands are now proper named commands with a
transient menu (?) listing them, so you’re never stuck trying to remember
whether locals was l or L.
Tracing grew a home
clojure.tools.trace-style tracing has been in CIDER forever, but the output
was always interleaved into the REPL, where it fought with your actual work.
CIDER 2.0 gives traces a dedicated, live-streaming *cider-trace* buffer:
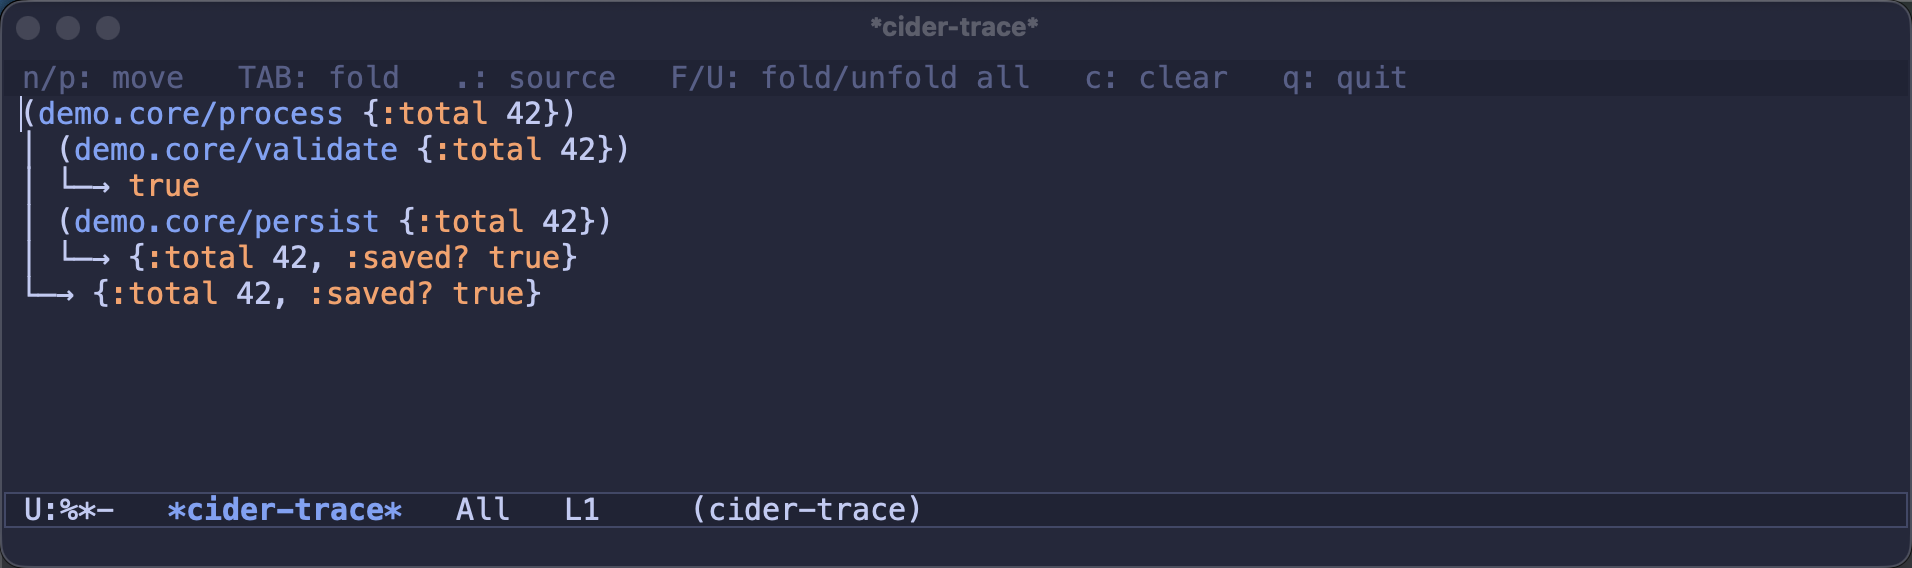
Calls fold and unfold (TAB, or F/U for everything at once), n/p move
between calls, and . jumps to a function’s definition. cider-list-traced
answers the eternal “wait, what did I even trace?”, and cider-untrace-all
cleans the slate.
Enlighten, back from the dead
Enlighten - the mode
that displays the values of locals inline as your code runs - has been in
“experimental” limbo since 2016. It finally got a proper overhaul: a real test
suite, fixes for the same record/deftype instrumentation bugs as the debugger
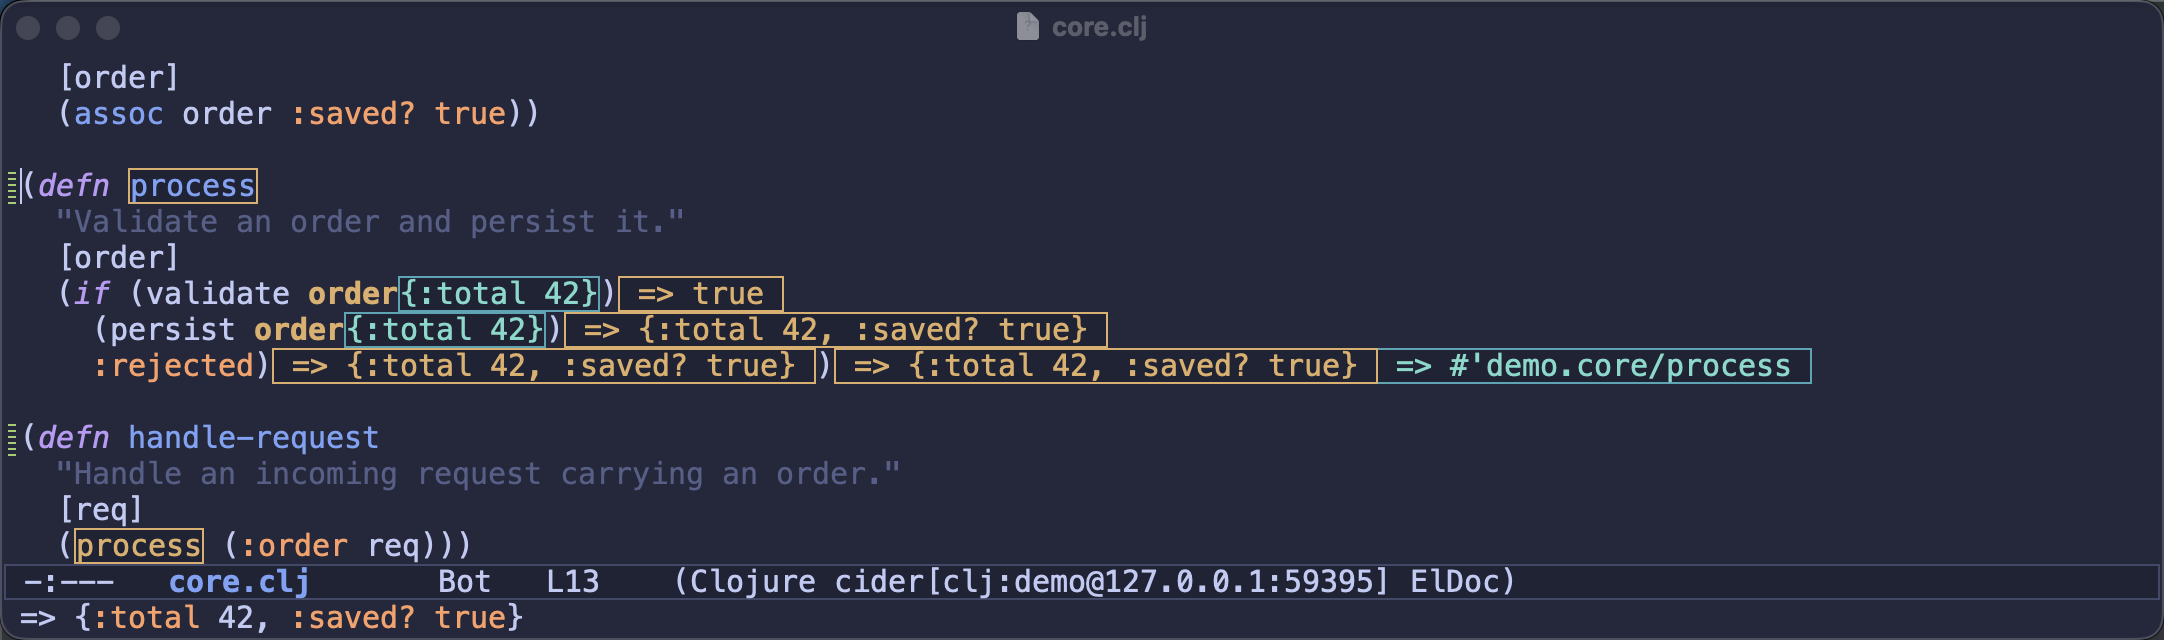
(they share machinery), and - importantly - manners. You can now enlighten a
single form with cider-enlighten-defun-at-point instead of flipping a global
mode, and cider-enlighten-stop turns everything off at once, rather than
making you re-evaluate every function in penance.
Every local and every intermediate result, right there in the buffer:
Tap into your programs
New in 2.0: cider-tap, a buffer that streams every value sent to tap> and
lets you crack any of them open in the inspector with RET. tap> has quietly
become the Clojure community’s favorite debugging primitive, and now you don’t
need an external tool like Portal or Reveal for the basic workflow - though
those remain great if you want more. (ClojureScript taps stream too; they’re
just not inspectable, since the values live in the JS runtime.)
It’s println debugging, minus the println guilt.
The connective tissue
A few related quality-of-life items round out the picture: stack frames for
top-level anonymous functions jump to their actual source instead of
clojure.core/fn (a bug from
2020), ClojureScript
frames render their ns/fn properly, and the macroexpansion tooling - a
debugging tool in its own right - got a full makeover that deserves (and will
get) its own article.
None of these tools is new. That’s rather the point: the 2.0 debugging story is mostly the existing tools becoming trustworthy. A debugger you don’t trust is worse than no debugger at all.
The debugging docs cover everything in detail. Keep hacking!