Sayid 0.8
Sayid 0.8 is out! It’s the third release since I brought Sayid back from the dead a couple of weeks ago, and it has a clear theme: making the tool easy to pick up. The revival releases were mostly about the engine - bounding the recording, consolidating the API, getting the data out. This one is about the experience. If you’ve ever bounced off Sayid because you couldn’t figure out what to press, or what it was trying to tell you, 0.8 is for you.
It started with a bug report
Shortly after the revival post, someone reported that pressing c i in the
workspace view - “inspect this captured value” - printed Def'd as $s/* and
then… nothing. The fix turned out to be a one-liner: Sayid was calling a
CIDER function whose signature changed years ago, and nobody had noticed since.
Which tells you everything about how many people were actually using that
command.1
The one-liner was easy, but the report got under my skin. If the inspector integration could sit broken for years, what else about Sayid was quietly hostile to anyone trying it for the first time? So I sat down and did a proper UX audit of the Emacs client, wrote down everything that made me wince, and 0.8 is the result.
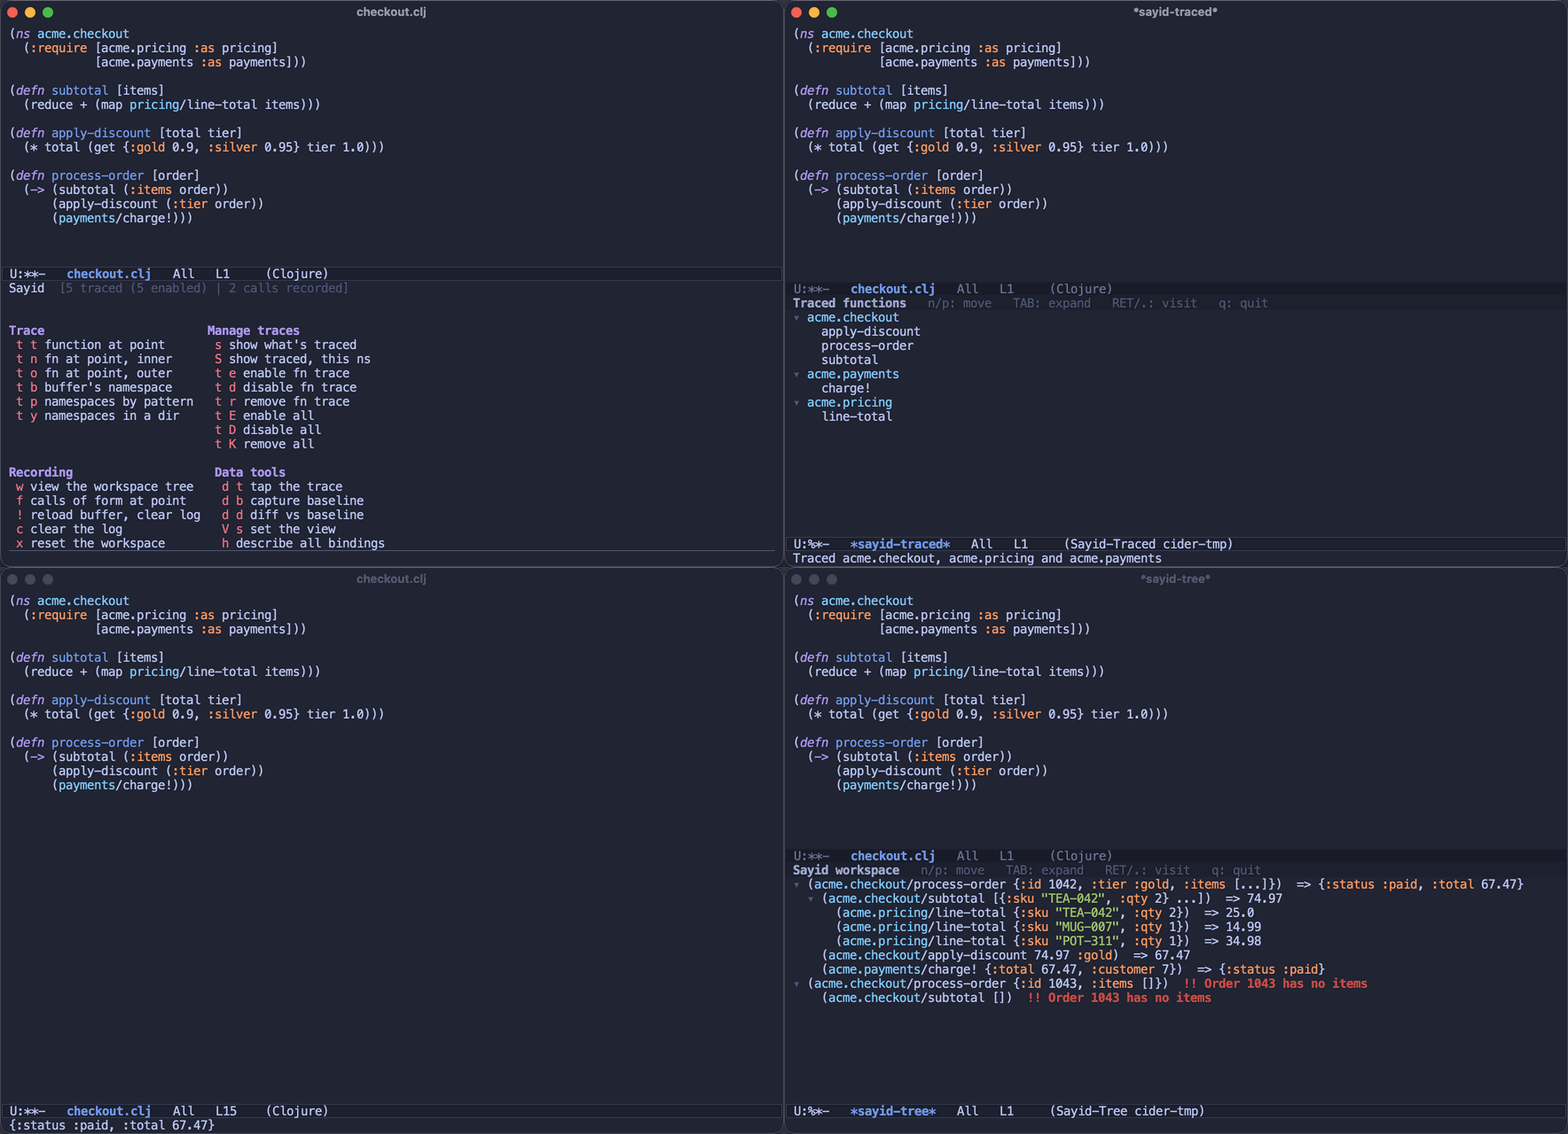
Here’s the current state of affairs in one take - trace, run, explore:
Catching up: 0.6 and 0.7
Before we get to the UX work, a quick recap of the two releases I never got around to announcing (the revival post covered things up to 0.5).
Sayid 0.6 rebuilt inner tracing - the mode that records every
intermediate expression inside a function - on top of tools.analyzer.jvm.
The old implementation re-read your source and rewrote raw forms, with special
cases for individual macros; the new one works off the analyzed AST. That
killed the long-standing bug where an inner-traced try/catch would swallow
exceptions, along with the per-macro special-casing that made the old
instrumenter so fragile.
Sayid 0.7 made the trace itself data. sayid.data/trace-data
returns the recorded call tree as plain Clojure data with the live captured
values, and tap-trace! sends it to tap>, so you can explore a recording in
Portal or your data tool of choice. It also added sayid.golden - capture
a run’s call tree as a baseline, then assert future runs still match it, which
is a surprisingly pleasant way to pin down the behavior of gnarly legacy code
before refactoring it.
The highlights
Now, the 0.8 goodies. The full list is in the changelog, but here’s what I’m most excited about:
- There’s a proper entry point now:
C-c spops up atransientmenu (sayid-menu) that groups the commands along Sayid’s core loop - trace something, run your code, explore the recording - and shows you how much is traced and recorded right now, or what’s missing (a REPL, the middleware) when you’re not connected. The menu uses the same key sequences as the classic prefix map, so your muscle memory keeps working, andsayid-use-menubrings the plain keymap back if popups aren’t your thing.
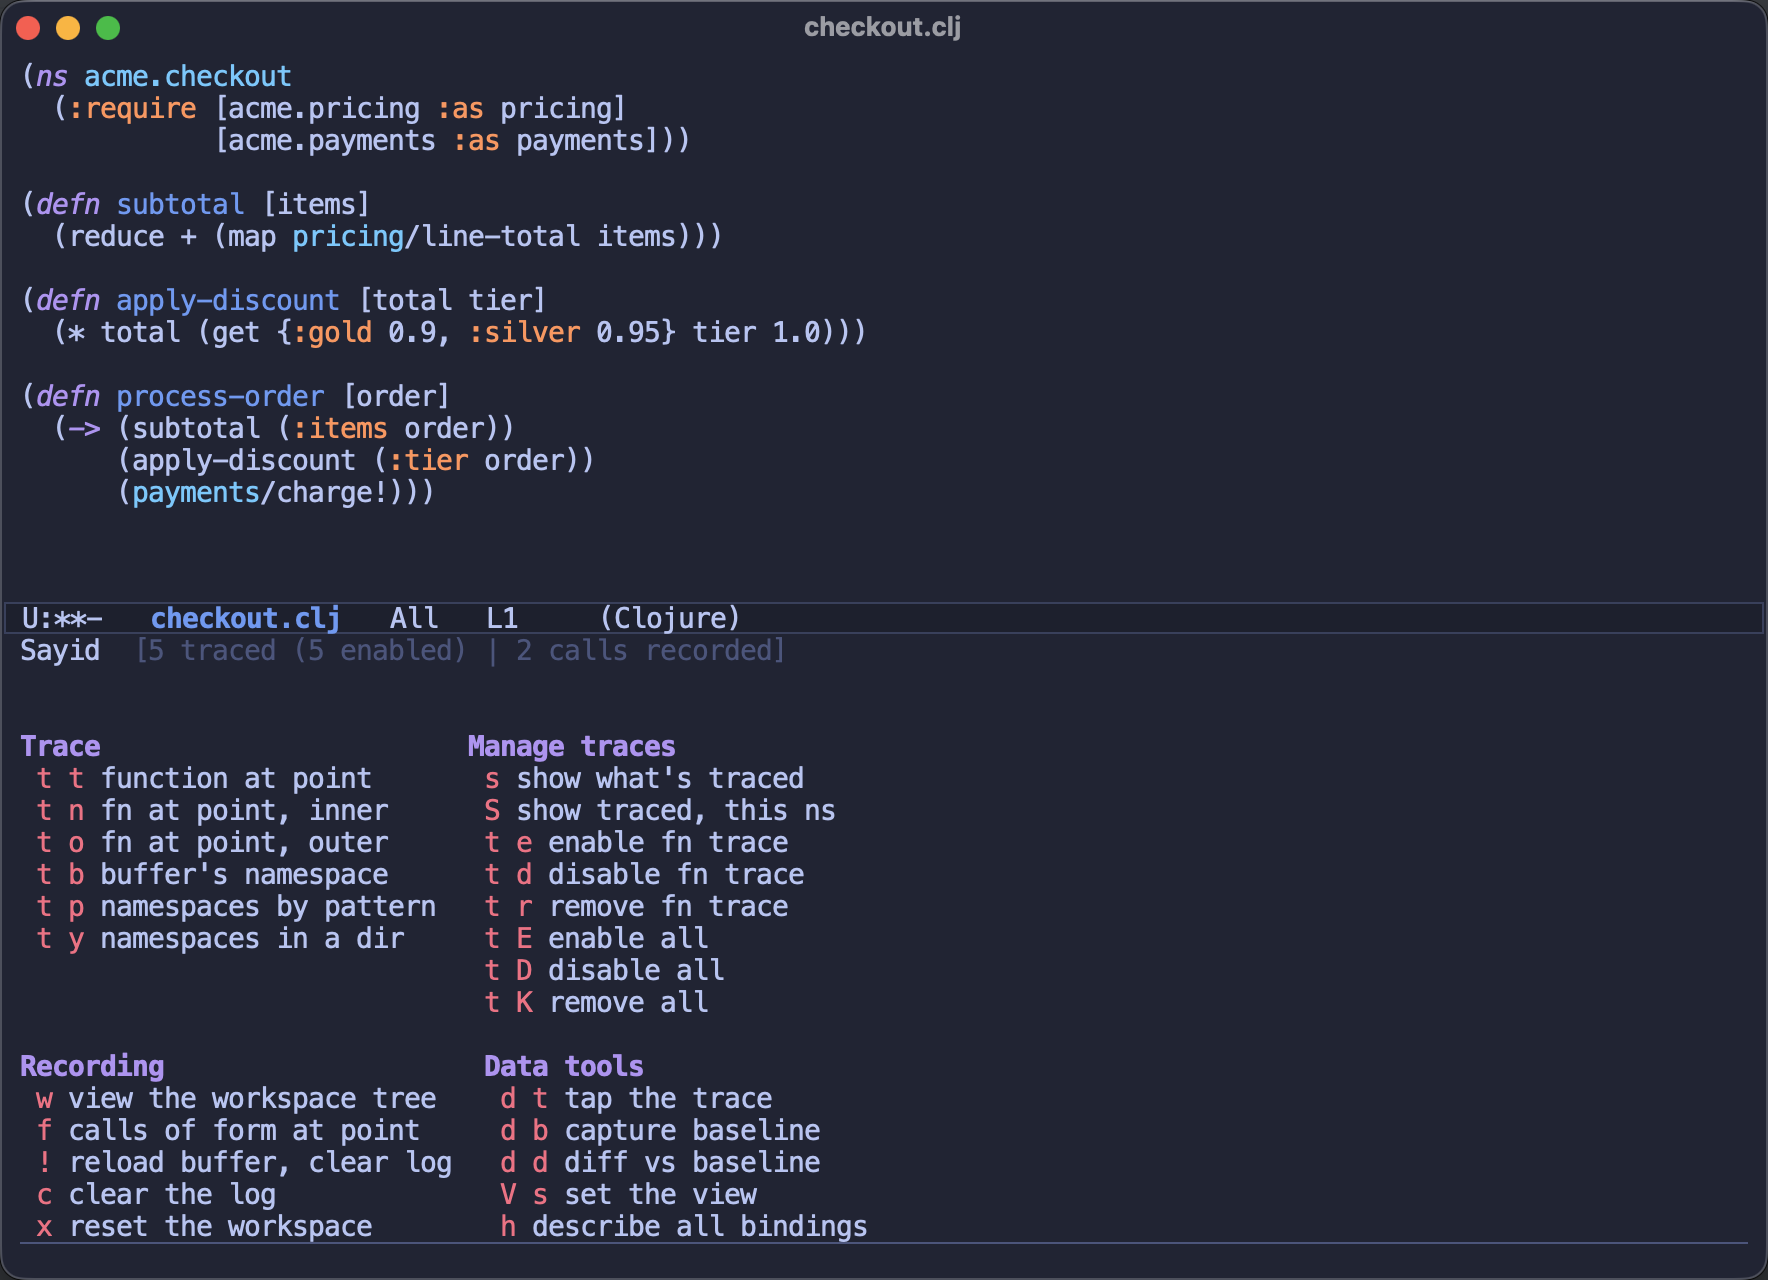
sayid-trace-fn(C-c s t t) is the new “just trace this” command. You no longer need to know what inner and outer traces are before you can trace your first function - the default does the right thing, and you can graduate to the fancier variants later.- Empty views teach instead of scolding. Opening the workspace before anything was recorded used to greet you with an error; now you get the buffer anyway, with a short walkthrough of how to get data into it. The first five minutes with Sayid should no longer require reading the manual.
- The commands talk back like a human. Tracing a function now tells you what
happened and what to do next (“Outer-traced acme.checkout/subtotal - run some
code, then
C-c s wshows what was recorded”), and trying to enable a trace that doesn’t exist tells you the actual problem instead of pretending everything went fine. - The workspace tree is now the one view to rule them all: on any call you can
inspect a captured value in CIDER’s inspector (
c i- yes, it works now), def it to a var for REPL poking (c d), pretty-print it (c p), or copy an expression that reproduces the call (c r).C-c s f- show the recorded calls of the form at point - renders there too. - A pile of small courtesies that add up: tracing a function no longer steals
your window with a popup,
grefreshes the Sayid buffers like every other Emacs buffer, and resetting the workspace asks before irreversibly dropping your traces and recording. - The client and the middleware now tolerate version skew - if your
deps.ednpins an older Sayid jar than your Emacs package expects, things degrade politely instead of erroring in strange ways. - The Emacs client now requires CIDER 2.0, which let me drop a bunch of
compatibility shims and lean on the new
cider-tree-viewthroughout. - And the README finally shows the tool instead of just describing it - screenshots and the GIF above included. A picture of a call tree is worth a thousand words about one.
Upgrading notes
Nothing here should break a working setup, but two things are worth knowing.
The Emacs package now requires CIDER 2.0 (released earlier this week), so
they’ll need to be upgraded together. And C-c s now opens the menu instead of
acting as a bare prefix - every old key sequence still works exactly as typed,
but if you prefer the old silent prefix, set sayid-use-menu to nil. A few
commands got more consistent names (sayid-trace-fn-outer and friends); the
old names live on as obsolete aliases.
Onward
When I wrote the revival post I asked people to kick the tyres and tell me what feels rough. This release is what acting on that feedback looks like, and it’s exactly the kind of contribution I need more of - a two-line bug report turned into the biggest usability overhaul in the project’s history. So thanks to everyone who has been trying out the revived Sayid, and please keep the reports coming on the issue tracker.
[mx.cider/sayid "0.8.0"] is on Clojars, the Emacs package is on MELPA, and
tracing your first function is now a single C-c s t t away. Give it a spin!
Keep hacking!
-
In fairness, it also tells you something about me - the bug shipped with my own resurrection releases. Reviving a decade-old codebase means inheriting a decade of API drift, and some of it only surfaces when a real user presses a real key. ↩